


Two Cold War Stories
This research project really began way back in August 18, 1960, at the tip of a converted intermediate-range ballistic missile launched from California’s Vandenberg Air Force Base. The missile’s payload was an American satellite, codenamed CORONA, part of a secret program to spy on the Soviet Union’s nuclear capabilities at the tense height of the Cold War.
The first twelve CORONA missions had been failures. One capsule was lost off the coast of Norway. Another was successfully retrieved, but when opened it was found that the acetate-based film had snapped in the frigid vacuum of space.
But this attempt, the lucky thirteenth, was successful. Soon, capsules containing crisp, high-resolution, black-and-white photos of Soviet missile sites were dropping regularly from orbit.
“We’ve spent 35 to 40 billion dollars on the space program,” said President Lyndon Johnson in 1967, referring also to the famous Mercury, Gemini, and Apollo missions, “and if nothing else had come out of it except for the knowledge gained from space photographs, it would be worth ten times what the whole program has cost.”
From 1960 to 1982, CORONA and its successor, Keyhole-9, collected hundreds of thousands of images from almost the entire land surface of the Earth, giving the United States a rare peek into the military and industrial secrets of its global rival.
At around the same time, a momentous change was occurring in another communist nation. In the late 1970s, a new Chinese leader named Deng Xiaoping wrested power from Mao Zedong’s chosen successor, Hua Guofeng, and began experimenting with more moderate economic policies to correct for the excesses of the previous era. China was emerging from the wreckage of two major disasters—the Great Leap Forward, a failed industrialization push that starved 30 million people to death; and the Cultural Revolution, a violent political upheaval championed by Mao that verged on civil war—and Deng was looking for a new approach that might stabilize the Communist Party’s rule and spur development.
These post-1978 policies defined what in China is called the era of Reform and Opening (gaige kaifang). The communal farms were broken up, and peasant households were allowed to keep some of the surplus crop to sell on the market. New firms known as Township and Village Enterprises (TVEs) sprouted up across the countryside, manufacturing goods for foreign and domestic markets. Special Economic Zones (SEZs), designed to attract foreign investment, created boomtowns almost overnight in the coastal cities of Shenzhen, Xiamen, and Zhuhai. Together, the Reform and Opening policies sparked a takeoff that has driven China’s rise to this day.
It’s hard not to be moved when one thinks of what China’s economic transformation meant for the lives of hundreds of millions of people. According to the World Bank, in 1981, almost 90% of China’s population lived on less than $1.90 a day (in 2011 dollars, at purchasing power parity), compared to just 4% in 2016—which means, in raw numbers, 800 million lifted out of extreme poverty. Infant mortality fell from 52 children per 1,000 live births in 1978 to around 6 in 2018. China’s economic takeoff is one of the great events of the twentieth century; in the alleviation of human suffering, it may have no equal.
But what policies were actually responsible for China’s miraculous transformation? How can we distinguish between the slew of different reforms that were occurring all at the same time?
Unfortunately, here economists must be more circumspect. Chinese economic statistics can be as much vehicles for political promotion as records of the truth—official province GDPs, for instance, often add up to a number greater than the GDP of the whole country. The rigorous empirical work of modern economists, with its careful attention to cause and effect, is just a non-starter without reliable data. Economists have made creative use of what data exists to get at different aspects of the Chinese miracle, but too many of the basic statistics—like output and population—are missing to form a complete picture.
Even as countries as varied as Ethiopia and Vietnam try to emulate China’s growth model, the lack of data hinders precise answers about what helped China to take off. There simply isn’t a good external source to see what was happening inside China at the time.
That is, except for the American spy satellites orbiting overhead.
A Window into the Past
The goal of this research project is to fill the China data gap. With my co-author Joel Ferguson, a PhD candidate in Berkeley ARE, we are working on constructing new measurements of China’s growth miracle using the CORONA and KH-9 spy satellite photos.
Recent advances in machine learning—in particular, technologies known as convolutional neural networks—have made it possible to extract economic data from satellite pictures. Just as a neural network may be trained to recognize a face in a photo, or read text from a scanned document, so too can they learn how to measure economic data from a picture, like a village’s population or the amount of crops growing in a field. Previous pioneering work–including by Berkeley’s Solomon Hsiang–has shown the enormous potential of applying machine learning to contemporary satellite imagery to measure economic outcomes, particularly in Africa. Archaeologists have used the CORONA images to find excavation sites in remote places, while environmental scientists have used them to measure deforestation and the impacts of climate change. But, to our knowledge, we would be the first economists to use the CORONA and Keyhole-9 satellite photos to gain a rare window into China’s growth miracle.
A natural question to ask at this point is, if the official Chinese data is so unreliable, what exactly can we use to train our model? As the ancient computer science proverb goes—garbage in, garbage out.
Our solution is to rely on data from village gazetteers, grassroots historical records compiled by local officials. These sources have become increasingly popular in China studies, as they contain a wealth of information independent of the government’s main statistical apparatus. As historian Kristen Looney observes, for sources from Mainland China, the gazetteers can often be astonishingly critical of central government mistakes. One gazetteer article from Xinli, Tianjin notes how, during the Great Leap Forward, peasants were forced to transplant rice seedlings into a Potemkin field to fool visiting officials. Another from Wanfeng village, Shenzhen quotes the misery of peasants in 1954 after a draconian change to the government’s grain policies:
This year even if you point a gun at my heart, I still would rather keep sufficient grain for myself before selling ... I would rather go to prison before selling.
Since Chairman Mao arrived, there has been no food for the peasants to eat; since Mao Zedong came, even with very bad food you can only fill one bowl.
By linking the data contained in the gazetteers to the CORONA and Keyhole-9 images, we can start to build a training sample for a model that can predict economic measures from the features of historical photos.
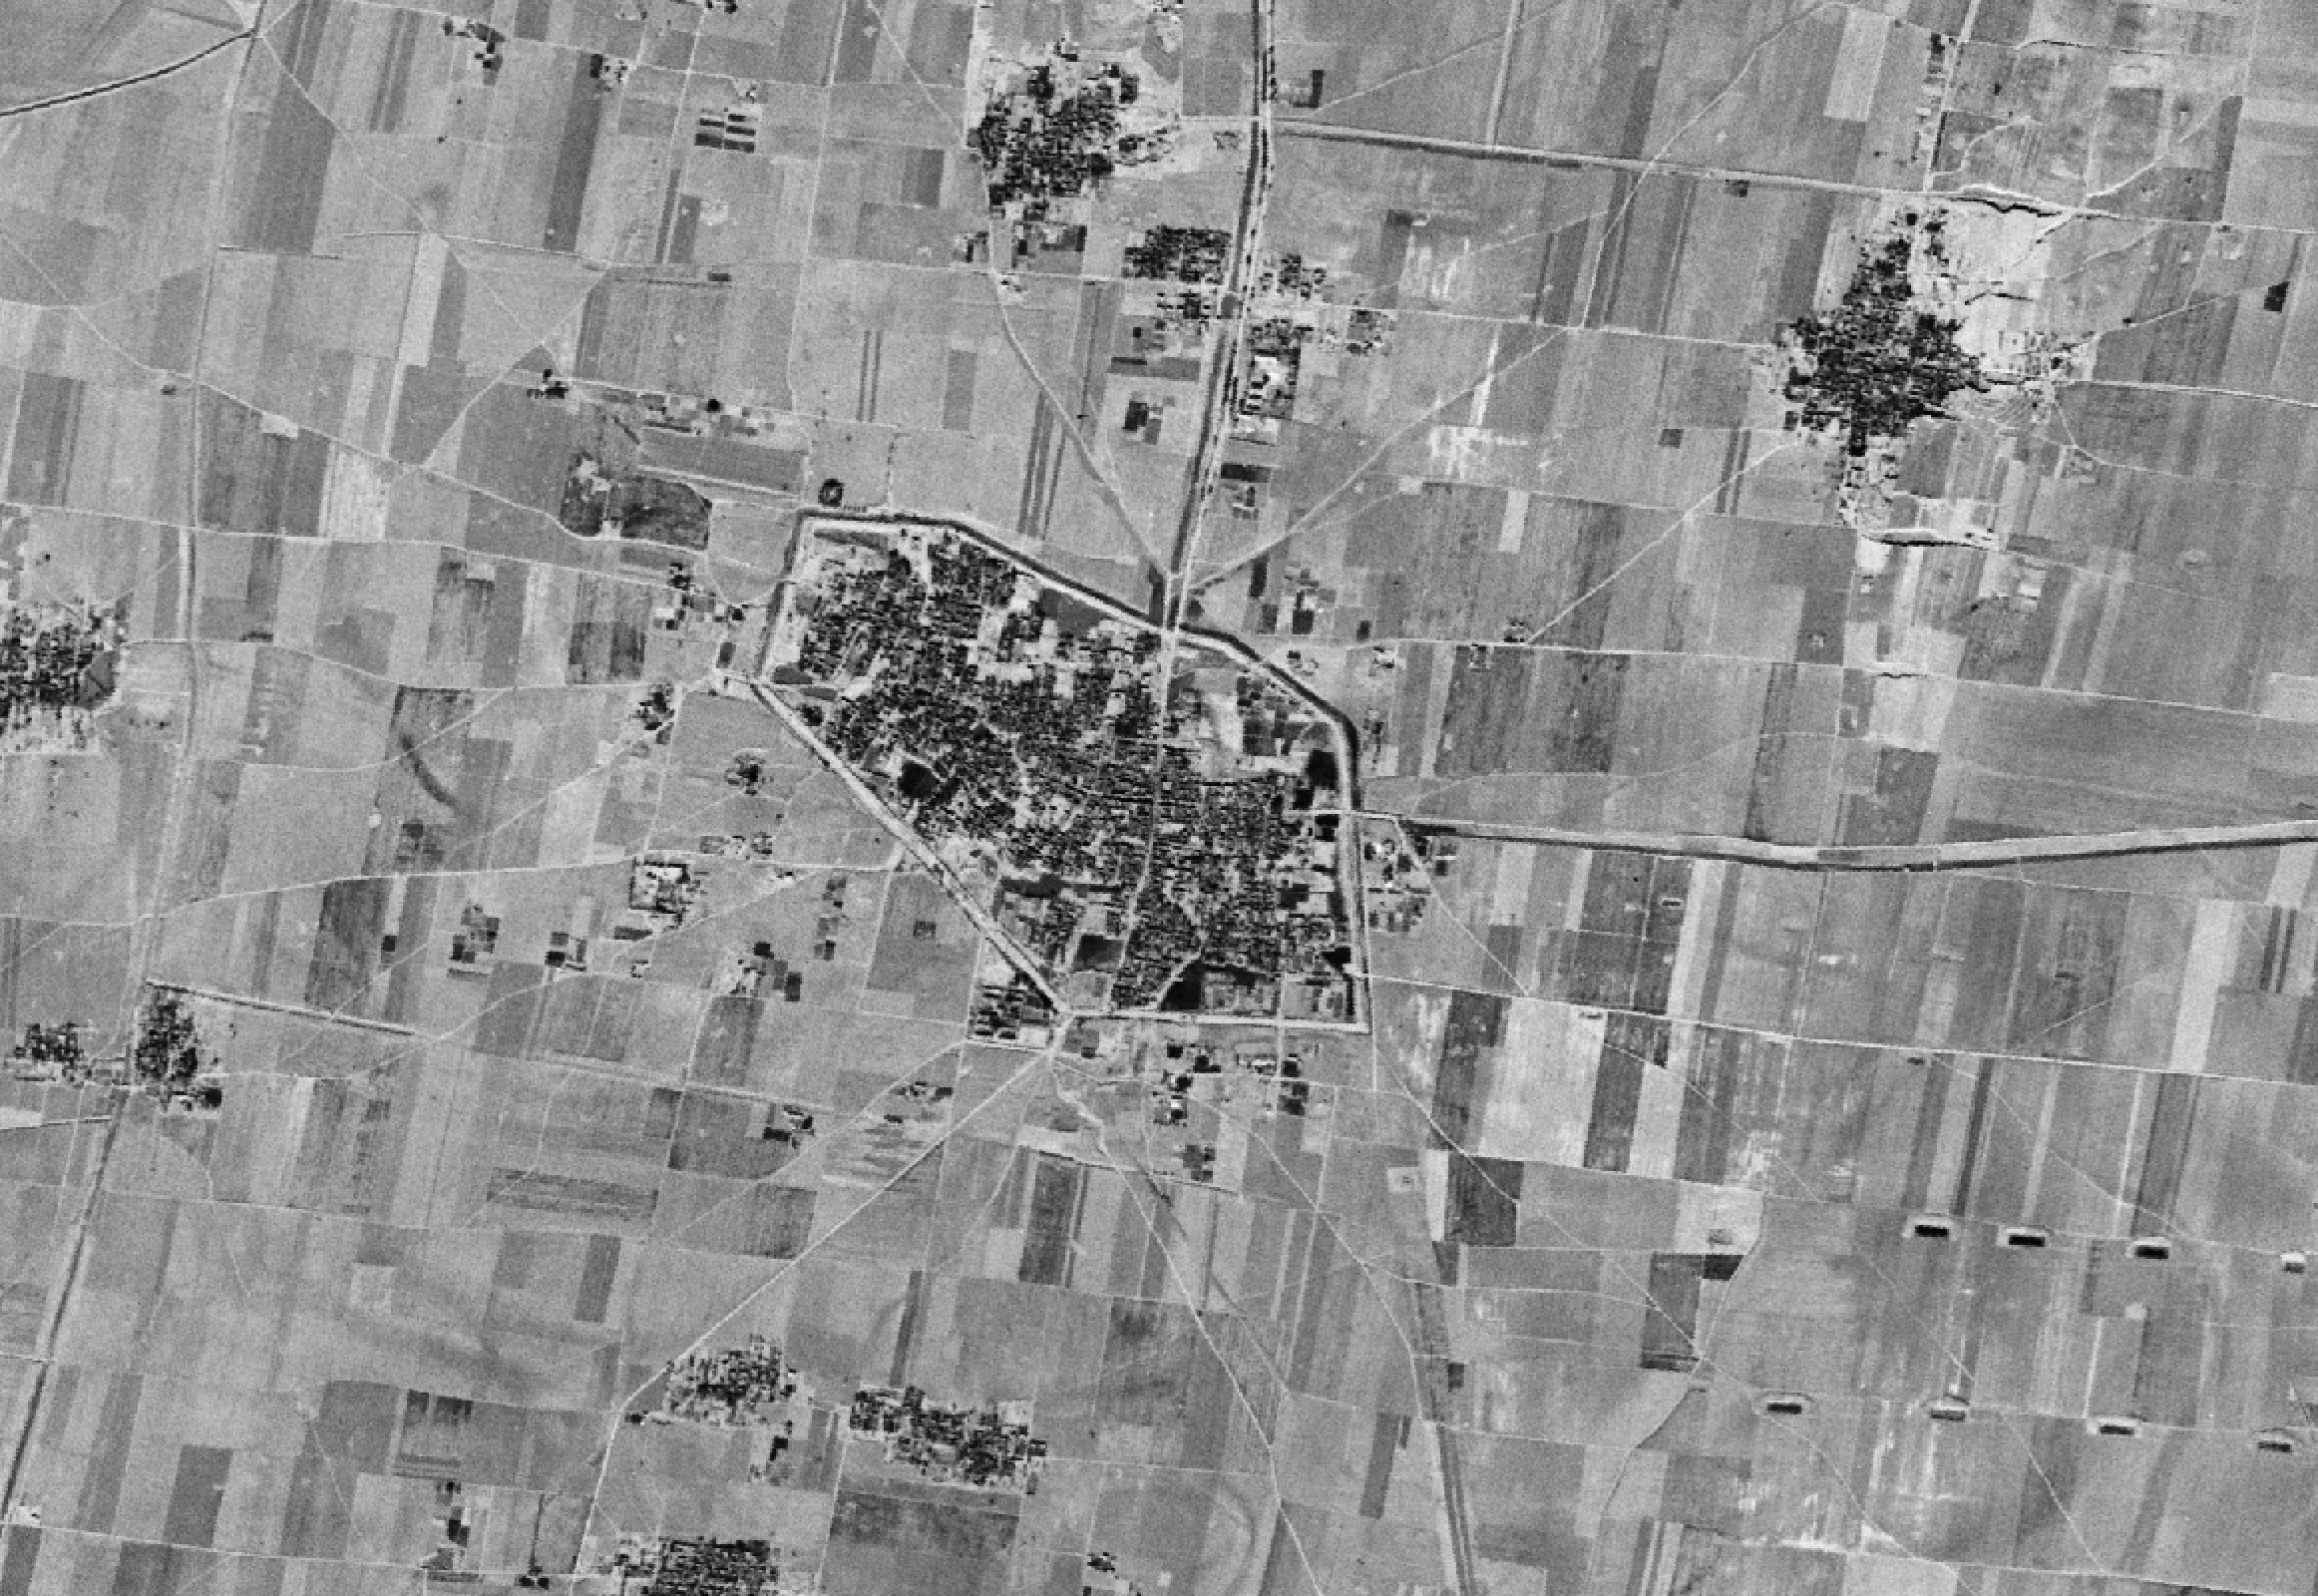
Take a look at the above example, a picture of a village in Henan Province from 1967. What’s immediately striking is just how high resolution the image is for its time—fine enough to see the boundaries between fields and the roofs of individual houses. All this represents economic information that a convolutional neural network can be trained to pick up. Already, we’ve found that even simple models trained on small sample sizes are able to accurately predict population and crop production. More sophisticated models, we hope, will be able to extract even more information and achieve higher accuracy.
Much of this remains in the future, however—and I hesitate to count chickens before they’ve hatched. We are still in early stages of assembling our database of satellite imagery. The CORONA spy satellite images were declassified in 1993, and the KH-9 images in 2013, but the majority still sit unscanned in film canisters in Washington DC, unseen since the days of the Cold War.
Each film strip has to be retrieved from the archives and scanned by the US Geological Survey (which costs $30 apiece). Each scan then has to be digitally stitched together to re-create the original film strip. Each stitched-together image then has to be geo-referenced by hand, to locate where exactly it was taken and to correct for the angle of the satellite camera, the curvature of the Earth, the distortions introduced by different lenses, etc. This has to be done several thousand times over, to cover a large enough sample size to satisfy a data-hungry deep learning model.
It’s painstaking, laborious work, and we’re still very much in the early days of raising funds and assembling our data. But we’re excited about the potential of this approach to generate historical data where none exists. Our ambition is to eventually release the images and our model for free, to let other researchers build upon our approach, finally opening up Chinese data for economic investigation.
Forty years after the last Keyhole-9 mission, spy satellites may find a second life as sources of knowledge—keys that can help us unlock the economic miracles of the past.